|
Introduction
Seismic reflection is the main tool in the interpretation
of offshore sedimentary sequences. The aim of these interpretations
is to construct a geologic history of a region by correlating sequence
geometries and the mechanisms that control this geometry. These
mechanisms are eustacy, tectonics, subsidence, and sediment flux.
We will explain the general rules used in defining seismic sequences
and facies, followed by how these are related with respect to both
geometry and time.
However, when interpreting seismic sequences, it is important to
keep several things in mind. The reflectors on the seismic line
are not necessarily a true depiction of lithologic features such
as bed thickness, depositional dip, or the scale of sedimentary
and tectonic structures. Seismic reflectors are a function of the
velocity and time of wave propagation through rocks and sediment
at depth and can only be converted to true thicknesses, etc., by
constraint with geophysical well log data, usually supplied by industry,
which can be used to quantify wave velocity through different geologic
materials.
Seismic Stratigraphy: Rules
and Definitions
The interpretation of seismic stratigraphy is based
on the identification of seismic sequences and on seismic facies
analysis.
Seismic Sequences:
A seismic sequence is the main element in the interpretation of
seismic stratigraphy. It consists of a succession of reflections
that are relatively concordant limited at the base and top by discontinuities
shown by the lateral termination of reflectors. A seismic sequence
has a chronostratigraphic significance becasue it was deposited
during a time interval determined by the ages of the limits at the
top and bottom of the sequence. However, these limits, which are
often discontinuous, are not necessarily isochrons due to either
a depositional hiatus or an erosional unconformity and could represent
anywhere from thousands to millions of years.
The identification of seismic sequences is based on the geometry
of the termination, at top and bottom, of a group of reflectors,
and are interpreted as the lateral termination of strata. An angular
unconformity on the seismic sections gives the limits by analyzing
the termination of reflectors, e.g. truncation due to erosion, downlap,
onlap, etc (Figure 1). The geometry of reflectors
within an individual seismic sequence is described using seismic
facies analysis.
Seismic Facies Analysis:
Seismic facies analysis consists of the parameters and reflection
configuration studies, which determine a seismic sequence (Figure
2). The aim of the facies analysis is to interpret reflections
with respect to lithology, stratification, and the characteristics
of the depositional environment. These parameters are:
Amplitude (strong or weak)- amplitude explains
the contrasts in density and the velocity of acoustic wave propagation
through different lithologic material and helps to define the lateral
variations within sequences.
Frequency (high to low)- The frequency, distance between reflectors,
depends on the differences in distance between strata (bed thickness),
as well as lateral variations in the velocity of acoustic waves
due to changes in lithology.
Continuity (good to discontinuous)- The continuity
of seismic reflectors is generally associated with the lateral extension
of uniform strata.
External form and internal configuration of facies units-
The form and internal configuration of facies units is generally
the first parameter that can be described on a seismic profile.
Traditionally certain forms and internal configurations (chaotic,
laminated, draped, noisy zone, etc.) are associated with particular
depositional environments (platform, gravity slides, filled channels,
canyons, reefs, etc.).
In practice, the lithologic interpretation is done with preceding
interpretation and correlated with lithologic and or geophysical
well log data. It is important to remain cautious and prudent in
seismic facies interpretaion without direct correlation with lithologic
data.
Sequential Stratigraphy
The goal of sequential stratigraphy is to reconstruct
in detail the modality of the deposits and the sedimentary geometry
in a chronostratigraphic context. The underlying assumption of this
method is that the sedimentary series is organized in a logical
geometric succession of isochronous depositional units controlled
by relative variations in basin scale sea level (Figure
3).
The sedimentary record in the basin is controlled by: eustacy (absolute
variations in global sea level); tectonics over a range of scales
(subsidence or uplift of the basin); the sediment flux.
In the sequential stratigraphy model, we consider depositional sequences
as a whole, i.e., sedimentary sequence deposited in a complete cycle
of relative sea level variation. The sequence itself can be divided
into different depositional packages corresponding to different
phases of relative sea level variation. For example, a regressive
megasequence is a succession of progradational depositional sequences
on a continental shelf and slope in the general context of regression.
Conclusions
The ability to carefully and accurately interpret seismic data is
an important and useful tool for any geoscientist. However, the
utility of this tool can only be maximized when it is carefully
applied. Above, we have presented some general guidelines that should
be followed in order to insure a robust sequential stratigraphic
interpretation through seismic sequence and seismic facies analysis
of 2-Dimensional seismic data. One method that we have not discussed
but that is important to mention, is the use of a network of high-angle
to orthogonal 2-D seismic lines. This type of network is the only
way to precisely determine the lateral distribution of seismic,
and therefore interpretation of lithologic, sequences and facies,
and is a crucial tool in the reconstruction of something like paleogeographic
maps. These are extremely useful in helping to determine sedimentary
sources and sinks, whether or not sediment was bypassing the basin,
and where, for industry, there are potential hydrocarbon source
and reservoir rocks.
|
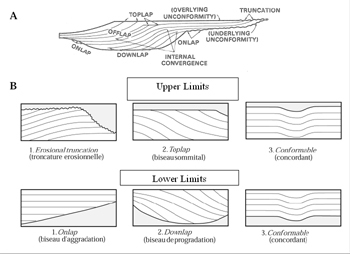
Figure
1 : Seismic sequence and reflector termination after
Mitchum et al. (1977). Reflector termination on an idealized
depositional sequence (A). Entry relations of seismic reflections
at the upper and lower limits of the sequence (B).
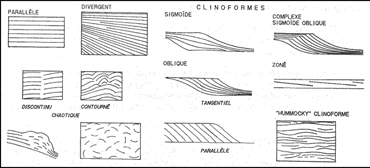
Figure
2: Some examples of characteristic seismic facies after
Mitchum et al. (1977). The motifs observed correspond to varied
depositional environments as a function of energy, subsidence, sea
level, etc.
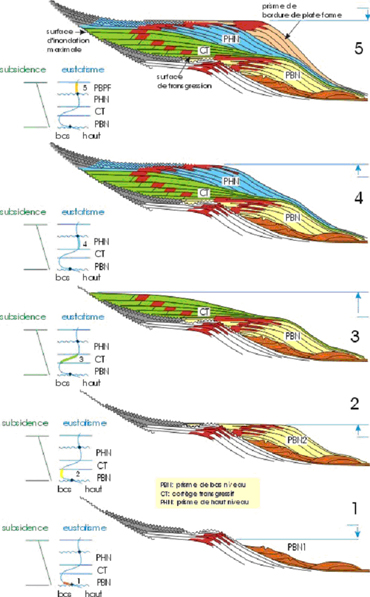
Figure
3 : Schematic representation of the Exxon Sequential Stratigraphic
model. Time moves from bottom to top (1-5). In red is the offlap
break of each sequence. Other colors (e.g. green, blue, tan, yellow)
depict megasequences deposited during different stages in relative
sea level. Smooth and wavy lines are conformable and unconformable
stratigraphic contacts, respectively. PBN, lowstand prism ; CT,
retrogradational prism; PHN, highstand prism; PBPF, stable platform
prism. For this particular illustration of a passive margin, sediment
flux and subsidence rate are constant and only the relative sea
level changes. This is depicted by the 'eustatisme' curve (low to
the left, high to the right). Time is on the vertical axis. Curved
colors correspond to isochronous depositional sequences.
_________________________________
|